At present, the group members maintain and develop the following libraries in R. The total number of libraries are 6:
1) alphahull: Computation of the alpha-shape and alpha-convex hull of a given sample of points in the plane.
2) alphashape3d: Implementation of the 3D alpha-shape for the reconstruction of 3D sets from a point cloud.
3) fda.usc: Functional Data Analysis and Utilities for Statistical Computing.
4) NPCirc package.
5) DCL: Double Chain Ladder Model.
6) DOvalidation: Local Linear Hazard Estimation with Do-Validated and Cross-Validated Bandwidths.
7) multimode: Mode Testing and Exploring.
1) alphahull: Computation of the alpha-shape and alpha-convex hull of a given sample of points in the plane.
The concepts of alpha-shape and alpha-convex hull generalize the definition of the convex hull of a finite set of points. The programming is based on the duality between the Voronoi diagram and Delaunay triangulation. The package also includes a function that returns the Delaunay mesh of a given sample of points and its dual Voronoi diagram in one single object.
| Version: | 2.0 |
| Published: | 2015-03-20 |
| Author: | Beatriz Pateiro-Lopez, Alberto Rodriguez-Casal |
| Maintainer: | Beatriz Pateiro-Lopez This email address is being protected from spambots. You need JavaScript enabled to view it. |
| Vignettes: | Generalizing the Convex Hull of a Sample: The R Package alphahull |
| CRAN: | http://cran.r-project.org/web/packages/alphahull/index.html |
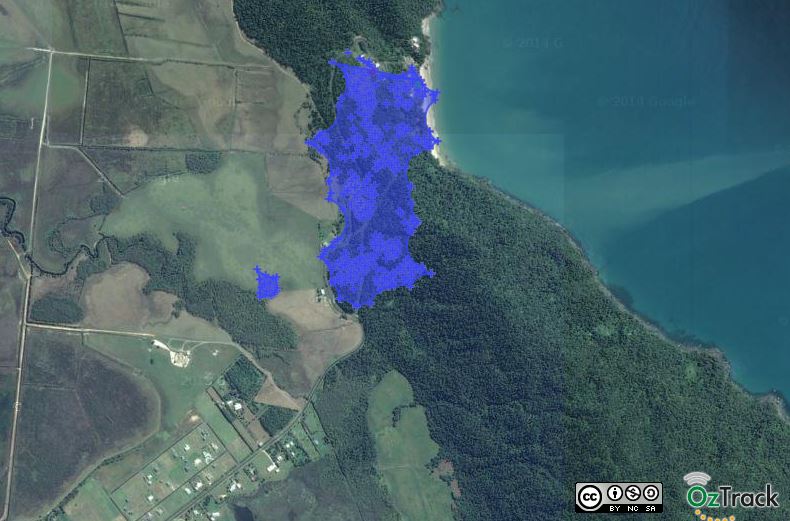
Home range estimation using the alphahull package for the project "Tracking cassowaries in Moresby Range National Park using GPS-based telemetry". (University of Queensland). Data and images from OzTrack (http://oztrack.org/)
2) alphashape3d: Implementation of the 3D alpha-shape for the reconstruction of 3D sets from a point cloud
The package alphashape3d presents the implementation in R of the alpha-shape of a finite set of points in the three-dimensional space. This geometric structure generalizes the convex hull and allows to recover the shape of non-convex and even non-connected sets in 3D, given a random sample of points taken into it. Besides the computation of the alpha-shape, the package alphashape3d provides users with functions to compute the volume of the alpha-shape, identify the connected components and facilitate the three-dimensional graphical visualization of the estimated set.
| Version: | 1.0 |
| Published: | 2014-05-23 |
| Author: | Thomas Lafarge, Beatriz Pateiro-Lopez |
| Maintainer: | Beatriz Pateiro-Lopez This email address is being protected from spambots. You need JavaScript enabled to view it. |
| Vignettes: | R Implementation of a Polyhedral Approximation to a 3D Set of Points Using the alpha-shape |
| CRAN: | http://cran.r-project.org/web/packages/alphashape3d/index.html |
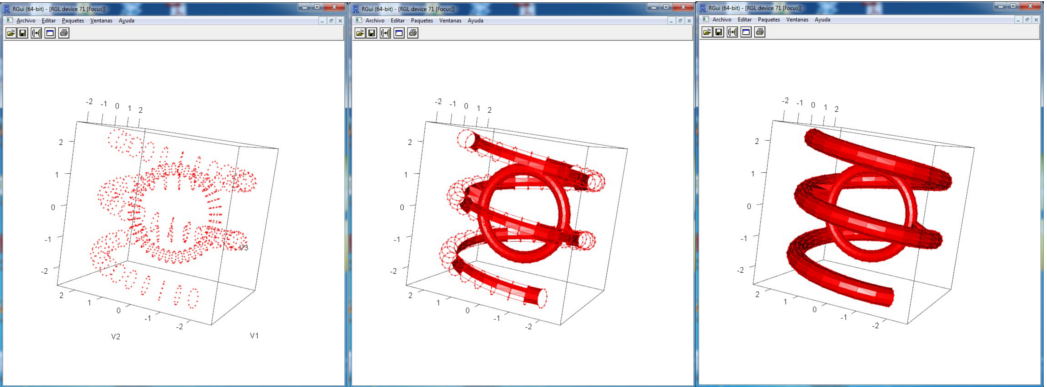
From left to right, α-shapes of a point cloud in 3D for increasing values of α
Functional Data Analysis and Utilities for Statistical Computing (fda.usc).
The new R package fda.usc includes methods for:
1. Functional Data Representation
2. Exploratory Functional Data Analysis
3. Functional Outlier Detection
4. Functional Regression with Scalar Response
5. Functional Supervised and Non-Supervised Classification
6. Functional ANOVA
The purpose of this package is to integrate own developments in Functional Data Analysis with those from other authors: fda package and/or group STAPH
The package fda.usc is avalaible through CRAN and further documentation are available:
| Package source: | fda.usc_1.2.1.tar.gz |
| Windows binary: | fda.usc_1.2.1.zip |
| Example R scripts: | script.zip |
| Reference manual: | fda.usc.pdf |
| News/ChangeLog: | NEWS |
![]()
The top left panel shows an example of functional data representation:
raw curve, B-spline smoothed curve and the kernel smoothed curve. The top right panel shows an example of location (functional mean) and dispersion (Confidence Bootstrap Bands 95% by Modal depth) measures for NOx levels on working days and non-working days. The panels in the bottom show an example of discrimination of spectrometric data: (in left) second derivative of absorbances curves coloured by the content of fat and (in right) the DD-Classifier based on DD-plot using GAM classifier and Modal depth.
This package implements nonparametric kernel methods for density and regression estimation for circular data. Specifically, a circular kernel density estimation procedure is provided, jointly with different alternatives for choosing the smoothing parameter. In the regression setting, nonparametric estimation for circular-linear, circular-circular and linear-circular data is also possible via the adaptation of the classical Nadaraya-Watson and local linear estimators. In order to assess the significance of the features observed in the smooth curves, both for density and regression with a circular covariate and a linear response, a SiZer technique namely CircSiZer is implemented. Some data examples are also included in the package, jointly with a routine that allows generating mixtures of different circular distributions
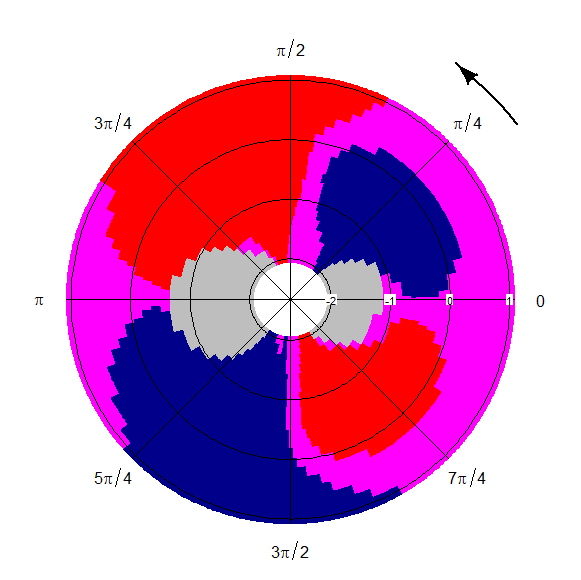
CircSiZer map for kernel density estimator for the dragonflies orientations data. For reading CircSiZer, take counterclockwise sense of rotation (marked by the arrow in the upper–right corner). Values of the smoothing parameter, which are transformed to −log10 scale, are indicated along the radius.
Claims Reserving under the Double Chain Ladder Model. Statistical modelling and forecasting in claims reserving in non-life insurance under the Double Chain Ladder (DCL) framework by Martinez-Miranda, Nielsen and Verrall (2012). The package implements the basic DCL model and several subsequent extensions.
| Version: | 0.1.0 |
| Depends: | lattice, latticeExtra |
| Published: | 2013-10-25 |
| Author: | Maria Dolores Martinez-Miranda, Jens Perch Nielsen and Richard Verrall |
| Maintainer: | Maria Dolores Martinez-Miranda <mmiranda at ugr.es> |
| License: | GPL-2 |
| NeedsCompilation: | no |
| CRAN checks: | DCL results |
Downloads:
| Reference manual: | DCL.pdf |
| Package source: | DCL_0.1.0.tar.gz |
| Windows binaries: | r-devel: DCL_0.1.0.zip, r-release: DCL_0.1.0.zip, r-oldrel: DCL_0.1.0.zip |
| OS X Snow Leopard binaries: | r-release: DCL_0.1.0.tgz, r-oldrel: DCL_0.1.0.tgz |
| OS X Mavericks binaries: | r-release: DCL_0.1.0.tgz |
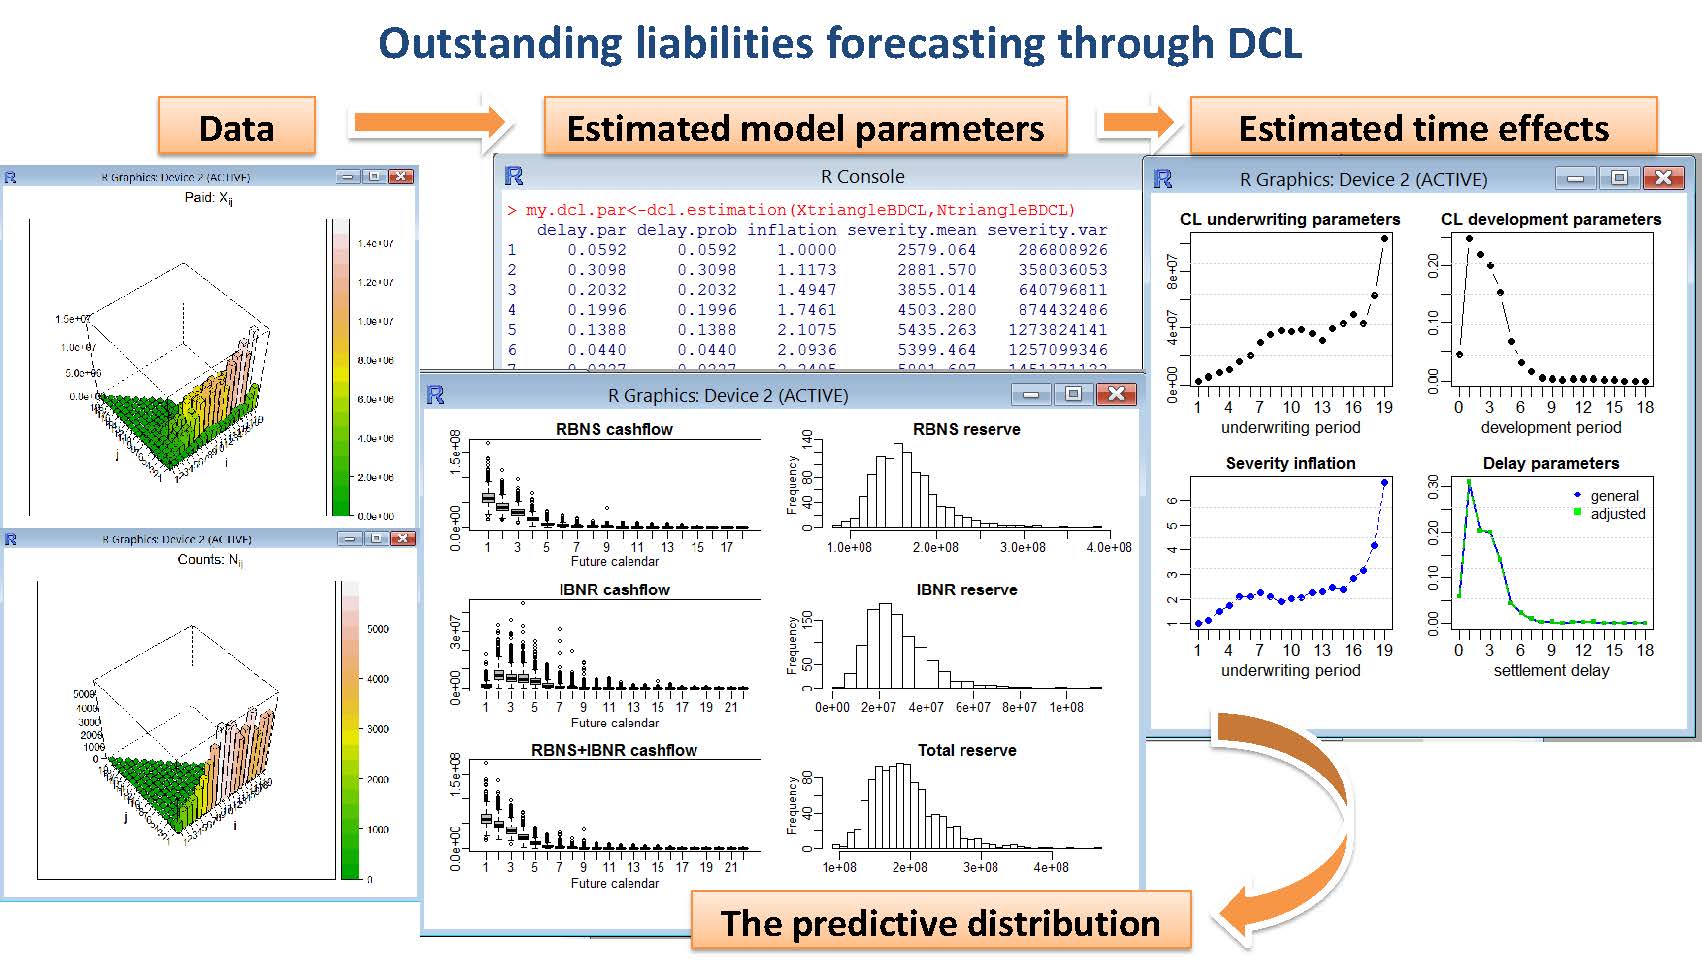
This figure shows an example of outstanding liabilities forecasting in non-life insurance using the Double Chain Ladder approach implemented in the DCL package. It works from two run-off triangles consisting of historical data about the number of reported claims and the paid amounts for such claims (histograms of these data are shown in the left side of the figure). Using this information, the Double Chain Ladder model (Martínez-Miranda, Nielsen and Verrall 2012) is estimated as a multiplicative model with two main time effects: underwriting period and development period (these effects are shown in the right side of the figure).
Simulating from the estimated model the predictive distributions of the future cash-flow and the reserve are approximated and plotted in the central panel using box plots and histograms.
DOvalidation: Local Linear Hazard Estimation with Do-Validated and Cross-Validated Bandwidths. Local linear estimator for the univariate hazard (hazard rate) and bandwidth parameter selection using the do-validation method and the standard least squares cross-validation method.
| Version: | 0.1.0 |
| Published: | 2014-11-09 |
| Author: | M.L. Gamiz, E. Mammen, M.D. Martinez-Miranda and J.P. Nielsen |
| Maintainer: | Maria Dolores Martinez-Miranda <mmiranda at ugr.es> |
| License: | GPL-2 |
| NeedsCompilation: | no |
| CRAN checks: | DOvalidation results |
Downloads:
tp://cran.r-project.org/bin/windows/contrib/3.0/DOvalidation_0.1.0.zip">DOvalidation_0.1.0.zip
| Reference manual: | DOvalidation.pdf |
| Package source: | DOvalidation_0.1.0.tar.gz |
| Windows binaries: | |
| OS X Snow Leopard binaries: | r-release: DOvalidation_0.1.0.tgz, r-oldrel: DOvalidation_0.1.0.tgz |
| OS X Mavericks binaries: | r-release: DOvalidation_0.1.0.tgz |
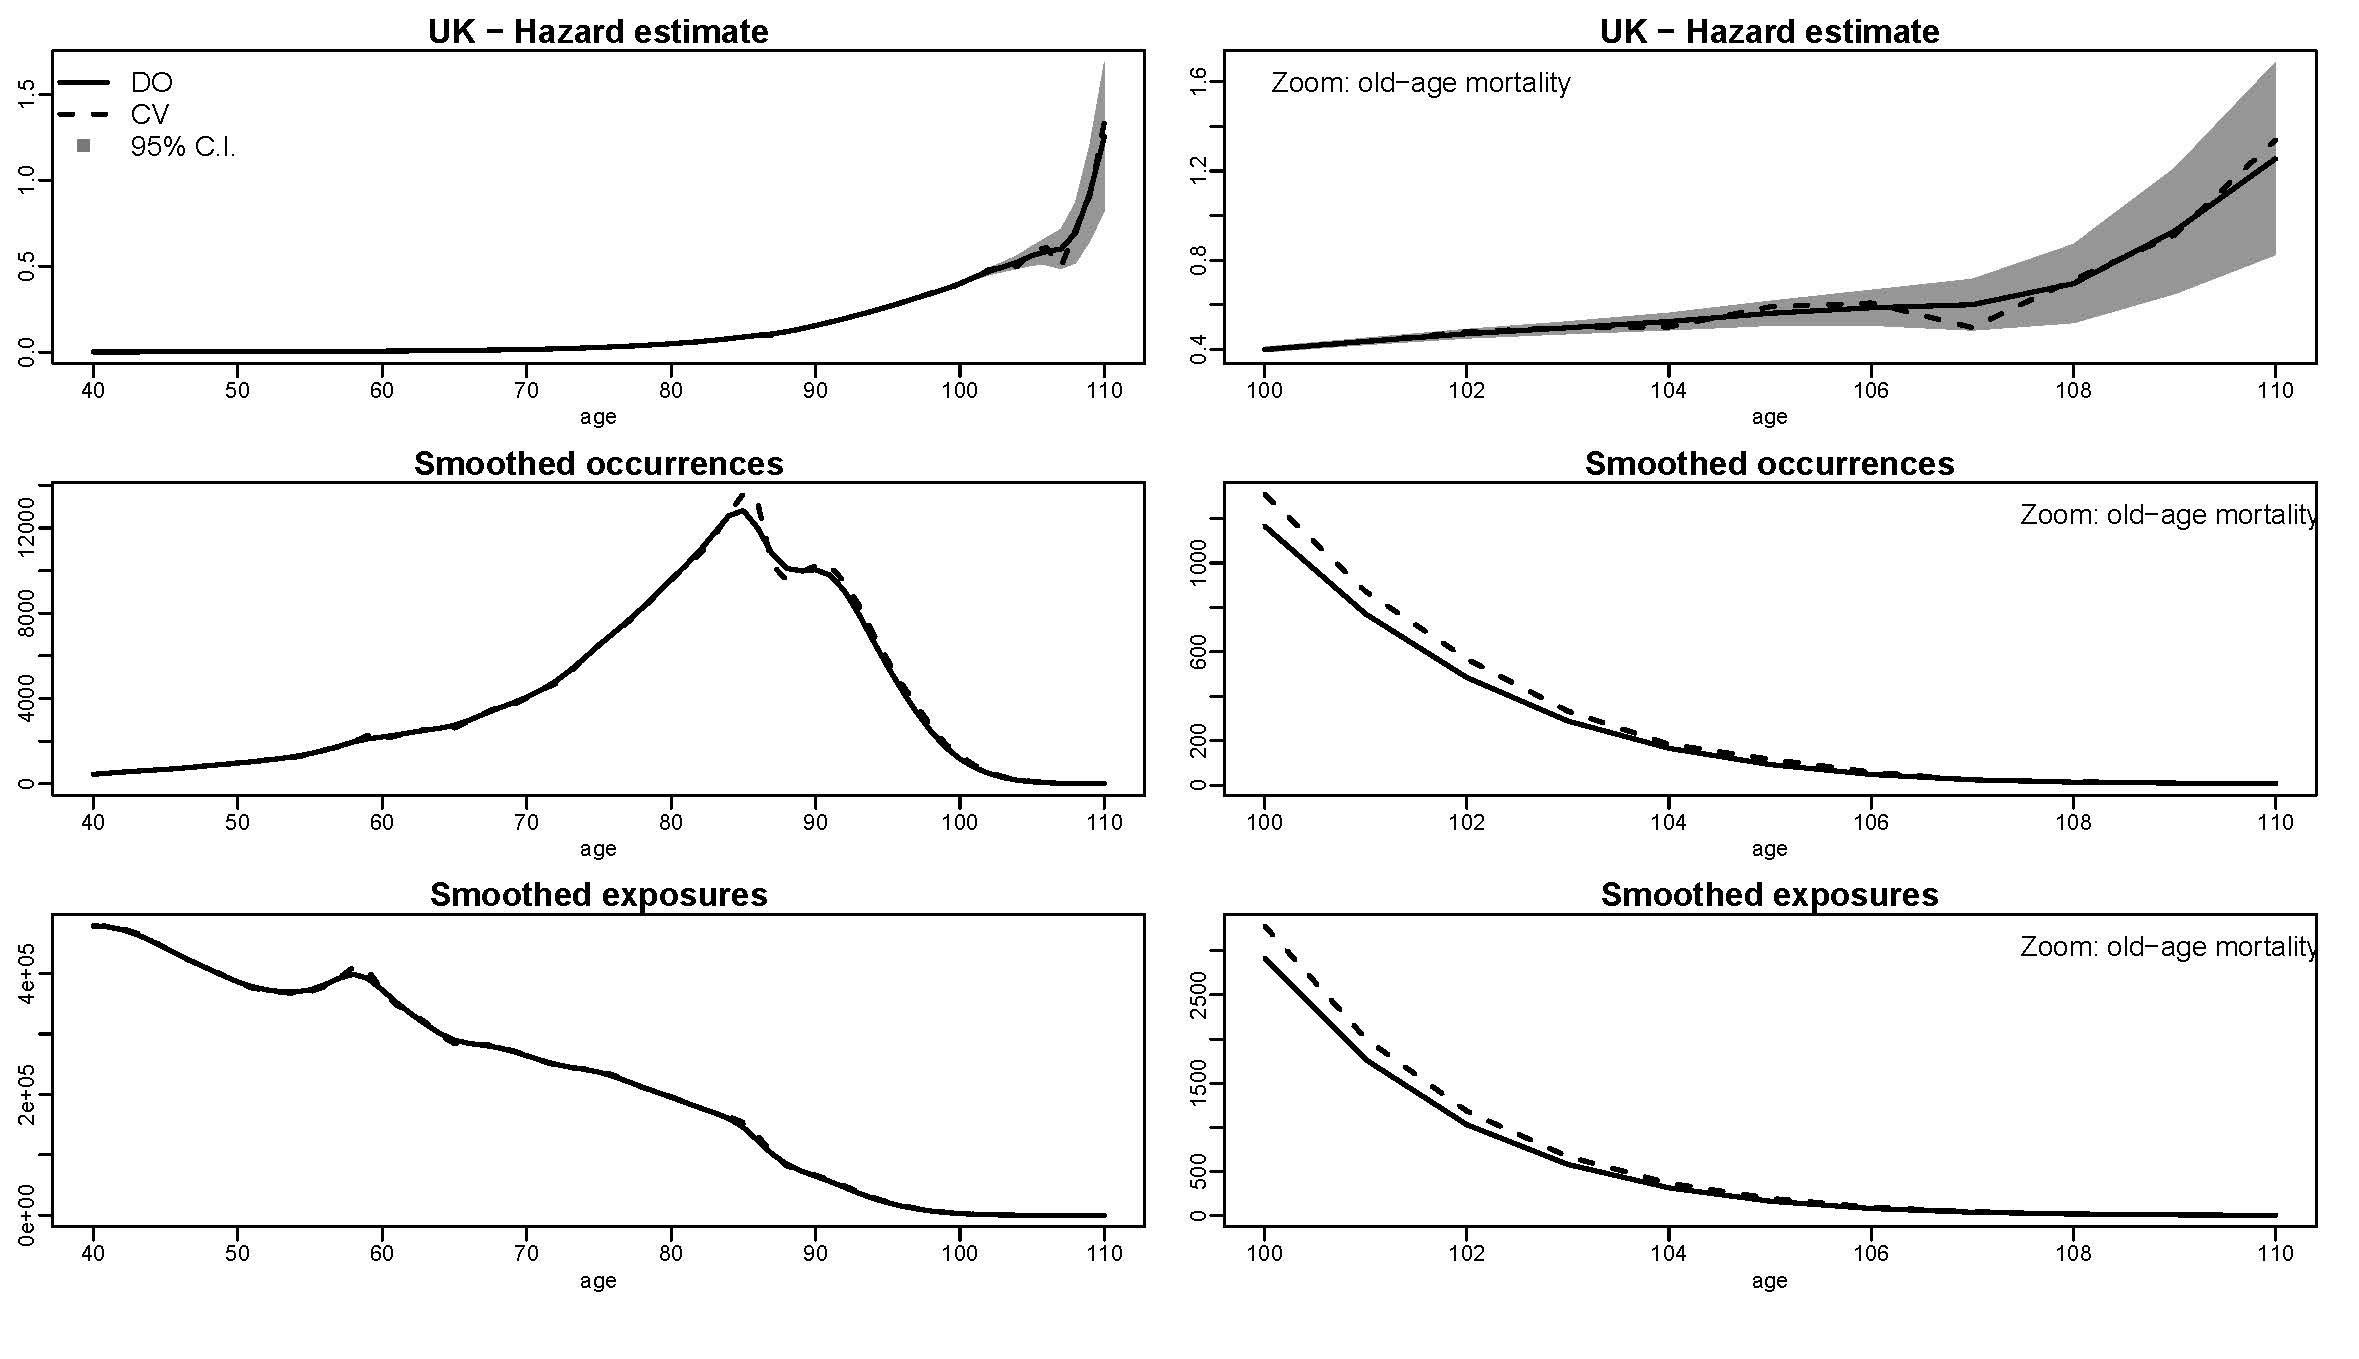
This figure shows the local linear hazard estimator in a case study on old-age mortality in U.K. The panels in the first row show the hazard estimator with two bandwidth choices: cross-validation and do-validation. The panels in the second and third rows show the two components defining the local linear hazard estimator as a ratio type estimator: the smoothed occurrences and the smoothed exposures. A close visual inspection of these components provides a better understanding of the performance of the hazard estimator in areas with very low exposures.
Different examples and methods for testing (including different proposals described in Ameijeiras-Alonso et al., 2016 <arXiv:1609.05188>) and exploring (including the mode tree, mode forest and SiZer) the number of modes using nonparametric techniques.
| Version: | 1.0 |
| Published: | 2017-10-19 |
| Author: | Jose Ameijeiras-Alonso [aut,cre], Rosa M. Crujeiras [aut], Alberto Rodríguez-Casal [aut], The R Core Team 1996-2012 [ctb,cph] (C function 'BinDist2' obtained from package 'stats'), The R Foundation 2005 [ctb,cph] (C function 'BinDist2' obtained from package 'stats') |
| Maintainer: | Jose Ameijeiras-Alonso <jose.ameijeiras at usc.es> |
| License: | GPL-3 |
| NeedsCompilation: | yes |
| CRAN checks: | multimodeOvalidation results |
Downloads:
| Reference manual: | multimode.pdf |
| Package source: | multimode_1.0.tar.gz |
| Windows binaries: | r-devel: multimode_1.0.zip, r-release: multimode_1.0.zip, r-oldrel: multimode_1.0.zip |
| OS X El Capitan binaries: | r-release: multimode_1.0.tgz |
| OS X Mavericks binaries: | r-release: multimode_1.0.tgz |
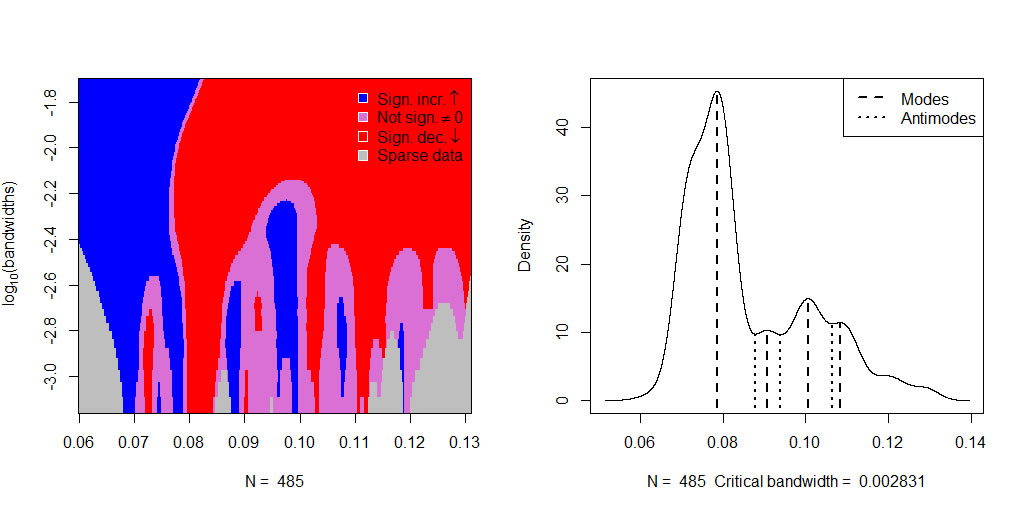
Figures include the estimated location of the modes and antimodes for a sample containing the thickness of different stamps from the 1872 Hidalgo Issue of Mexico. Left: SiZer map, given a bandwidth value (on the y-axis), modes can be detected in the blue-red patterns. Right: estimation after reaching the conclusion of having four modes in the underlying distribution of the data.
")
")